Penguin Explorer
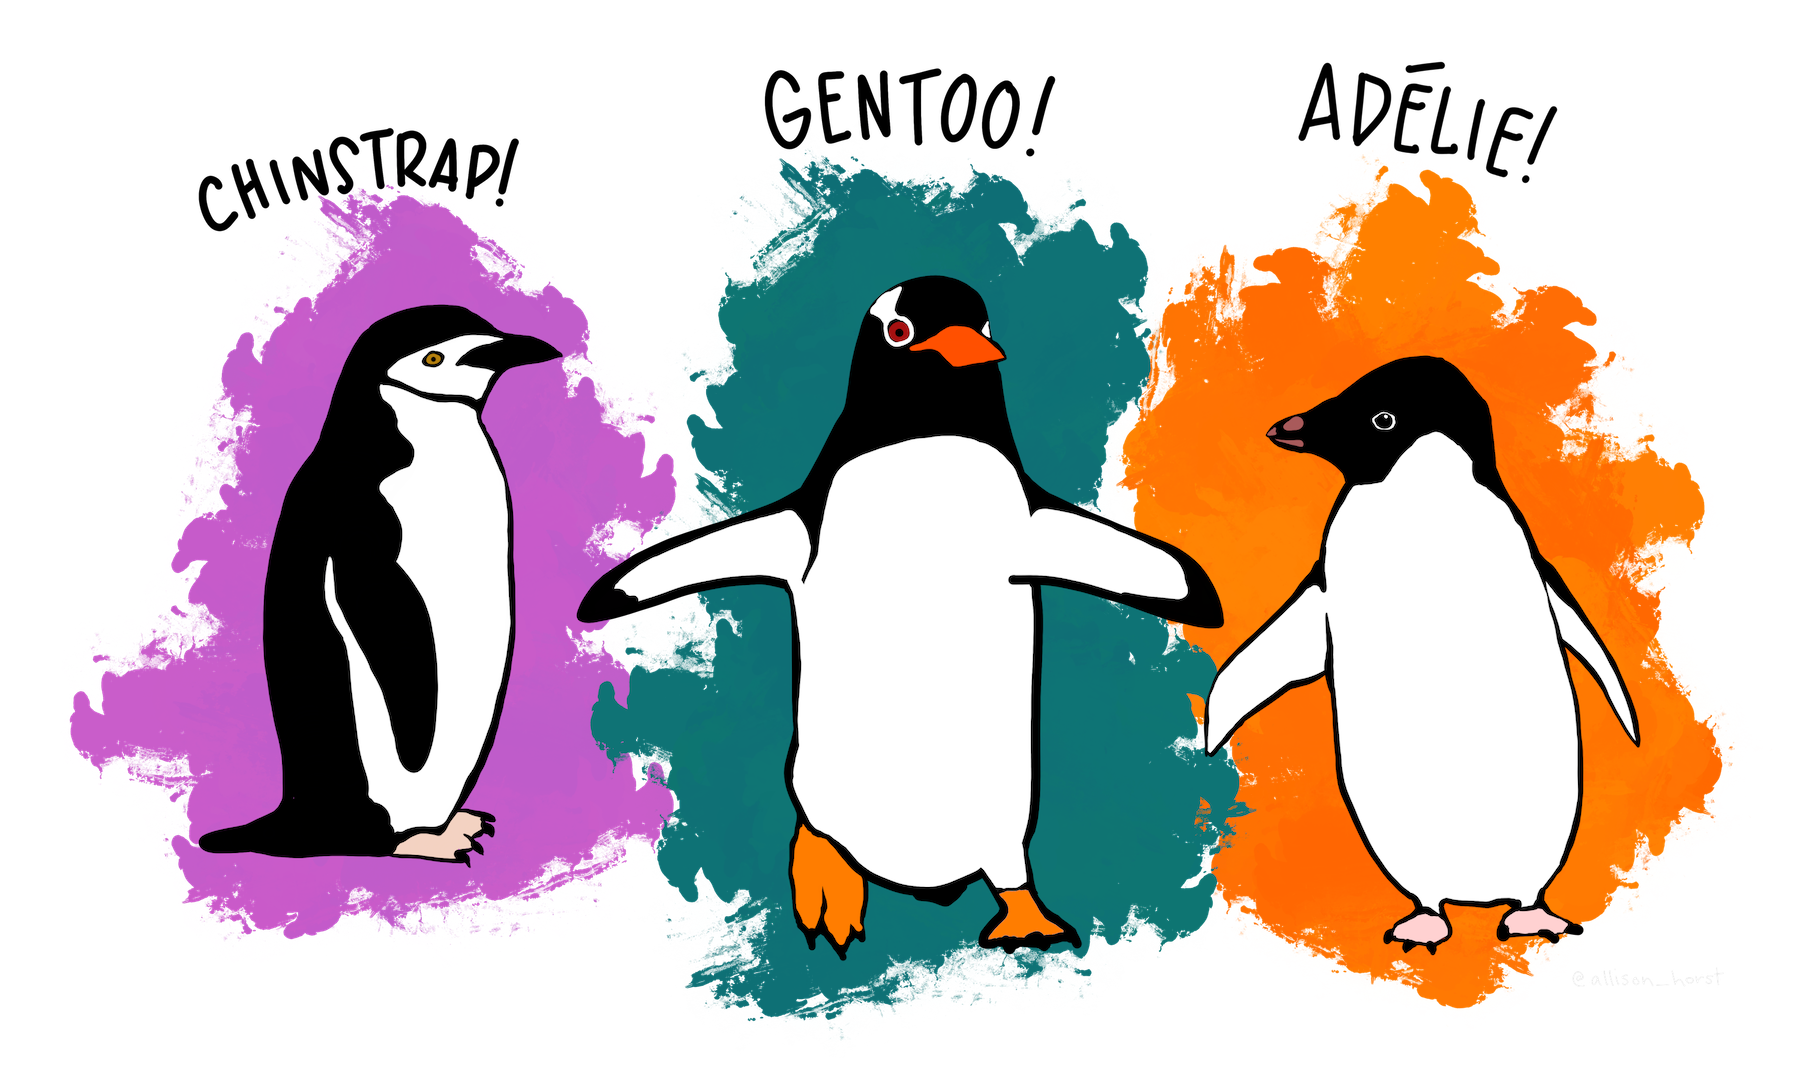
Overview
In this activity you’ll explore measurements of Antarctic penguins (the Palmer Penguins data) using third-party libraries for CSV parsing and statistics, plus the array functions you’ve been practicing.
Learning Objectives
- Load and clean real data with
fetch,async/await, andfilter - Use libraries you haven’t seen before by reading their documentation (
Papa Parse,simple-statistics) - Group and summarize data with loops and higher-order array methods
- Ask and answer your own questions about the data (by writing code!)
Getting Started
Download the starter code here (put both files in the same folder): penguins.html and analysis.js
All the code you write goes in analysis.js. The page, penguins.html, is already finished: it imports your functions, runs them, and displays the results.
Modules don’t load when a page is opened straight from your file system, so open it with Live Server in VS Code (or another local web server). If you see a blank page, check the console.
You’ll use two third-party libraries. You import both, at the top of analysis.js:
| Library | What it does |
|---|---|
| Papa Parse | Parses CSV text into row objects |
| simple-statistics | Mean, median, correlation, and friends |
Each row of the data looks like { species: "Adelie", island: "Torgersen", flipper_length_mm: 181, body_mass_g: 3750, sex: "MALE", ... }. Missing values are null.
Instructions
Fill in the TODO functions in analysis.js in order, testing in the browser after each one. (Open the DevTools console and use console.log to peek at your data.) Each part has a collapsed step-by-step hint. Try it on your own first, then open the hint if you need it.
Part 1: loadData
Fetch the CSV, parse it into rows with a CSV library, and keep only the rows where all four measurements are present.
Step-by-step
awaitafetch()ofDATA_URL.awaitthe response’stext()method to get the CSV as a string.- At the top of
analysis.js,importPapa Parse asPapafromhttps://cdn.jsdelivr.net/npm/papaparse@5.4.1/+esm(the/+esmat the end gives a version meant forimport). Read the Papa Parse docs forPapa.parse. - Call
Papa.parse(text, { ... })with options so that the first line is used as the header, numbers become numbers, and blank lines are skipped. (Look forheader,dynamicTyping, andskipEmptyLines.) The result’sdataproperty is the array of row objects.console.logit. You should see over 300 rows. - Use
filter()to keep a row only if every measurement inMEASUREMENTSis a number. (every()is handy here, and missing values arenull, which isn’t a number.) returnthe filtered array. Check the page! It should say how many penguins were loaded, and a scrollable table of all the penguins (built automatically from your rows) should appear. Use it to check your work.
Part 2: computeStats
Compute some statistics with simple-statistics, a library you haven’t imported yet! This code also goes in analysis.js.
Step-by-step
- At the top of
analysis.js,importsimple-statistics asssfromhttps://cdn.jsdelivr.net/npm/simple-statistics@7.8.5/+esm. Check the simple-statistics docs for how to import it. - Fill in the exported
computeStats(rows). Usemap()to make an array of every penguin’s body mass, and another of every flipper length. - In the docs, look up the functions for mean, median, and sample correlation. Call them on your arrays.
returnan object with the keysmeanMass,medianMass,meanFlipper, andflipperMassCorrelation.- Reload the page and make sure there are no errors in the console.
- The stats should appear in the list on the page. The correlation should be between 0.8 - 0.9.
Part 3: Explore by species
Now let’s compare the three species. Two of the measurements are of the bill: length and depth. They’re measured like this:

groupBy: Use a loop to turn the array of rows into an object of arrays, one per species:{ Adelie: [...], Chinstrap: [...], Gentoo: [...] }.averageByGroup: Given that object, compute the average of a measurement (likebody_mass_g) for each species. Usemap()to get the values, andssto find their mean.
The table of averages is shown for you. Use it, and the bill figure, for the first discussion question below.
Part 4: Ask your own questions! 🔎
Now, as a group, come up with three questions you have about the penguins. For example, “How much heavier are males than females?” or “Which island has the most Adelie penguins?”, etc. Use the data to answer each one in code, using array methods (filter, map, reduce, …) and functions from the stats module (ss)., and show the answers on the page with addAnswer(question, answer).
Fill in askQuestions(rows, addAnswer) in analysis.js.
For each question your team comes up with, call addAnswer("Your question?", "Your answer"), which adds it to the Our Questions list
on the page. Aim to finish at least three.
Additional Discussion
Then, if there’s time, talk about:
- Look at the table of averages. Which bill measurement (length or depth) separates Gentoo from the other two? Which separates Adelie? Is there any single measurement that separates all three?
- The correlation between flipper length and body mass is strong. Does that mean a longer flipper causes a heavier penguin? What else could explain it?
- Why does
loadDatathrow out penguins with missing measurements instead of treating them as0?
Submission
Submit your completed analysis.js (with your team’s three questions and answers), and your group’s answers to the discussion questions.