CS 444 Artificial Intelligence
PA2: Map Coloring using Min Conflicts
Learning Objectives
After completing this activity, students should be able to:- Implement a min-conflicts approach to map coloring (or in general, binary constraints embedded within a graph).
- Analyze the statistical variance in solution times for the map coloring problem with an iterative/random approach
python autograder.py --inputFile australia_mapcolor.csv --colorCount 3 --solutionFile australia_solution.pickle
Partners
This assignment may be completed individually or in pairs. If you are doing this in pairs, you must notify me at the beginning of the project. My expectation for pairs is that both members are actively involved, and take full responsibility for all aspects of the project. In other words, I expect that you are either sitting or virtually together to work, and not that you are splitting up tasks to be completed separately. If both members of the group are not able to fully explain the code to me, then this does not meet this expectation.Provided Files
Download this zip archive csp.zip which contains all the code and supporting files. Here is a short summary of what is contained within the zip file:| pa2_csp.py | Where all of your csp algorithms will reside. |
| australia_mapcolor.csv | Input that allows you to test your method with the map of Australia from the Russell/Norvig textbook. |
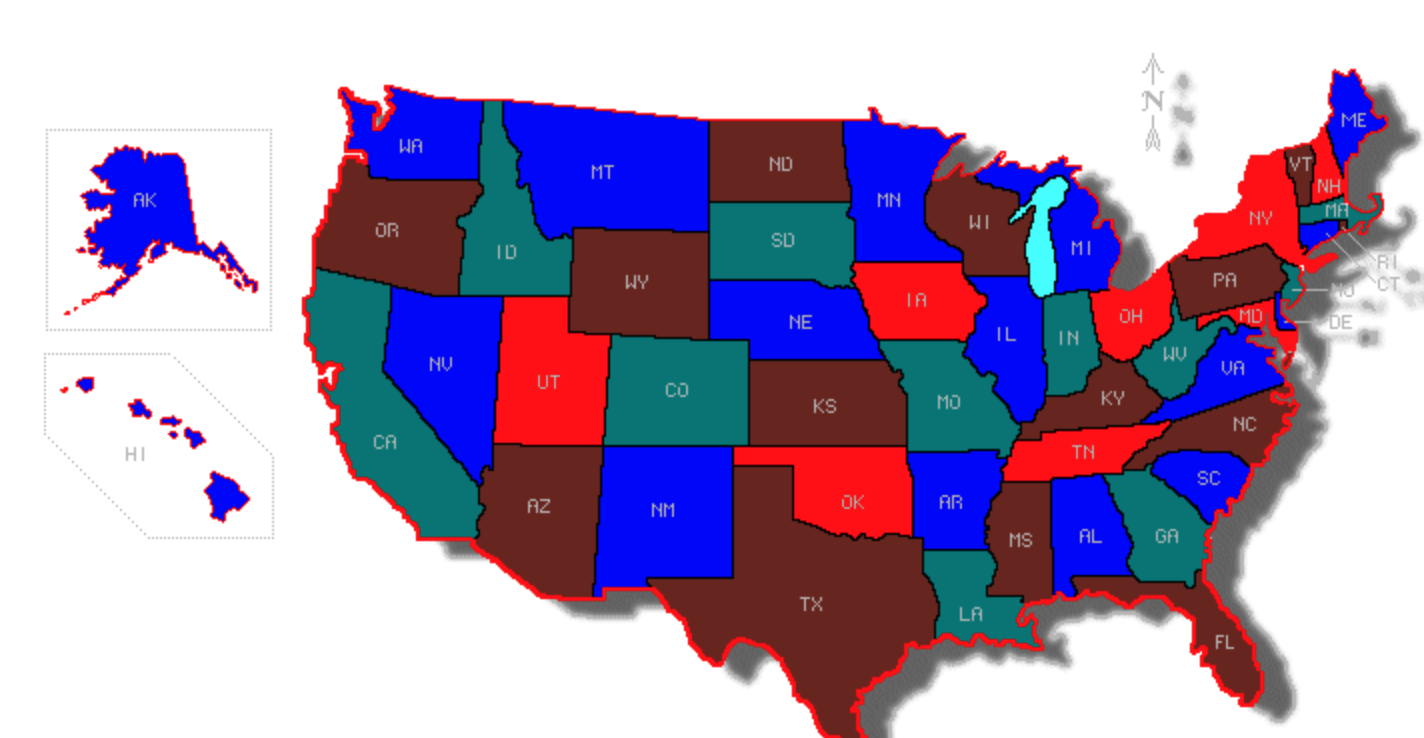
| usa_mapcolor.csv | Example input of a larger problem (US 50 states). |
| tvshow_edges.csv | An even larger input file where you will need to determine the minimum number of colors required to color the graph without violating the constraints (that 2 neighbors share the same color). |
Submission and Policies
You must submit the following files:cs444_pa2_csp.pyto Autolab. Your code should assign valid solutions and create validate solution files for all 3 input files. Autolab will use a few additional hidden test cases to validate your program.- A PDF report to Canvas that contains the following information:
- A paragraph or two that describes how your program handles the situation when it is not possible to color the map with the supplied number of colors is too low. To test this, try using the Australia example with k = 2.
- A paragraph that described how you determined the minimum number of colors for the TV shows dataset and the value you found for the minimum number of colors. For example, "I was able to color the TV Shows graph with 100 colors" (FYI, you should be able to do it in less than 100).
- An analysis of the runtime behavior. Run your program 30 times on the USA map coloring problem with k = 4. Plot a histogram (the same as the last assignment) that shows the distribution of the number of iterations it took your program to find a solution.
Evaluation: Your code will be autograded for technical correctness. Please do not change the names of any provided functions or classes within the code, or you will wreak havoc on the autograder. However, the correctness of your implementation – not the autograder’s judgements – will be the final judge of your score. If necessary, I will review and grade assignments individually to ensure that you receive due credit for your work.
Academic Dishonesty: Your code will be checked against other submissions in the class for logical redundancy. If you copy someone else’s code and submit it with minor changes, it will be detected. These cheat detectors are quite hard to fool, so please don’t try. I trust you all to submit your own team's work; please don’t let us down.
Getting Help: You are not alone! If you find yourself stuck on something, contact me. Office hours and Piazza discussion forum are there for your support; please use them. If you can’t make office hours, let me know and I will schedule a meeting with you. I want these projects to be rewarding and instructional, not frustrating and demoralizing. But, I don’t know when or how to help unless you ask.
Project Overview
In this assignment, you will construct a python program that implements the min-conflict algorithm to solve a map coloring problem. You will be given a graph G=(V,E) and must find an assignment of colors such that if two vertices are adjacent (an edge exists between them), the vertices must not be assigned the same color.
The secondary objective of this assignment is to find the minimum number of colors needed, k, in order to not violate any of these constraints on the TV shows dataset. This is known as the Chromatic Number (Diaz, Zabala 1999). For planar graphs, there are some theories on the minimum number of colors you will need (see informative section below). However, for nonplanar graphs (such as tvshow_edges.csv), you will need to explore different values of k (the number of colors available). This number and your technique must be contained with the PDF you submit to Canvas.
An interactive application for solving this problem is available if you want to experiment with it.
In designing your method, you will need to consider some questions that make utilizing min-conflicts challenging. Some of these questions may be very graph/problem dependent, such as:
- What happens in your method if you set k too small?
- How will you determine the minimum setting of k?
The starter code will read in the provided csv files into an adjacency list representation of a graph. The code also takes this representation and saves a dictionary containing the solution to a file known as a python pickle, which provides a mechanism for object serialization. The autograder reads this pickle file and validates the solution is correct.
Submissions will be graded according to the following rubric:
| Passes Unit Tests | 70% |
| Coding style | 10% |
| PDF report contains the required paragraphs on how your program addresses the case when too few colors are specified, the number of colors your solution found for the tvshows dataset, and also the histogram plot. | 20% |
Theorem on Map Coloring
> This section contains some supplemental information about map coloring (in other words, this information is not strictly needed to complete the proejct). Considered to be the first major theorem to be proved using a computer, the four color theorem was published in 1977 by Appel and Haken. The proof illustrates that any planar graph (a graph that can be drawn in a plane such that its edges intersect only at their endpoints/vertices) is 4 colorable. Examples of a planar and nonplanar graph are shown below. The input to this project will not necessarily be planar.