Qualitative (small, medium, large) vs. quantitative
(LOC or FP)
Modeling Technique:
Formal (e.g., use
regression analysis
to estimate parameters of the model from the data) vs. informal
(e.g., identify rules-of-thumb)
An Example - Organization-Specific, Quantitative, Informal
Background Information:
Function points for earlier products
A rule-of-thumb about organization-specific productivity
in function points per person-months (e.g., 5 FP/pm)
Labor cost in dollars per person-month (e.g., $12,000/pm)
Information about the Product:
425 FPs
Constructing a Point Estimate:
Effort: E = 425 / 5 = 85pm
Cost: C = 85 \cdot 12000 = 1020000dollars
An Example - Industry-Standard, Quantitative, Formal
KLOC-Based (L) Log-Linear:
Walston and Felix (1977): E = 5.2 L^{0.91}
Basili and Freburger (1981): E = 1.38 L^{0.93}
Boehm (1981): E = 3.2 L^{1.05}
FP-Based (F) Linear:
Albrecht and Gaffney (1983): E = -91.4 + 0.255 F
Kemerer (1987): E = -37.0 + 0.96 F
(Note that the negative y-intercept means
that these models are not appropriate for small values
of F.)
An Example - Organization-Specific, Qualitative, Formal
Data Collection (Humphrey, 1995):
Classify features from other products as very small,
small, medium, large, and very large
Collect data from other products on LOC per feature
(if done correctly, categories should vary by at least a
factor of 2)
Estimation:
Classify required features
Count the features in each classification
Multiply
Add
Some Common Models
The Software Equation:
E (effort) is a function of t
(project duration) and L (KLOC)
COCOMO II:
E is a function of L, F
(function points), or object points
International Software Benchmarking Standards Group:
E is a function of F
and N (team size) with specific parameters for
different physical architectures and languages
The Software Equation (Putnam and Meyers, 1992)
Additional Notation:
t denotes the project duration
B denotes a "special skills factor"
(B is 0.16 for products with fewer than
15 KLOC and increases to 0.39 for products with more than
70 KLOC)
p denotes a "productivity factor" that
reflects the process and practices, experience, and
product complexity (e.g., 2000 for real-time embedded
software, 12000 for scientific software)
The Two-Variable (L and t) Model:
E = \frac{L \cdot B^{1/3}}{p^3} \cdot \frac{1}{t^4}
The One variable Model:
t = 8.14 \frac{L}{p^{0.43}}
E = 180 B \left(\frac{t}{12}\right)^{3}
COCOMO II - Constructive Cost Model (Boehm, 1981/2000)
Collection of Models:
Pre-Requirements (Application Composition)
Stabilized Requirements (Early Design)
Construction (Post-Architecture)
Alternative Size Measures:
Lines of Code
Function Points
Object Points
Factors to Consider:
Scale factors
Product factors
Platform factors
Personnel factors
Project factors
COCOMO II (cont.)
Nominal Effort:
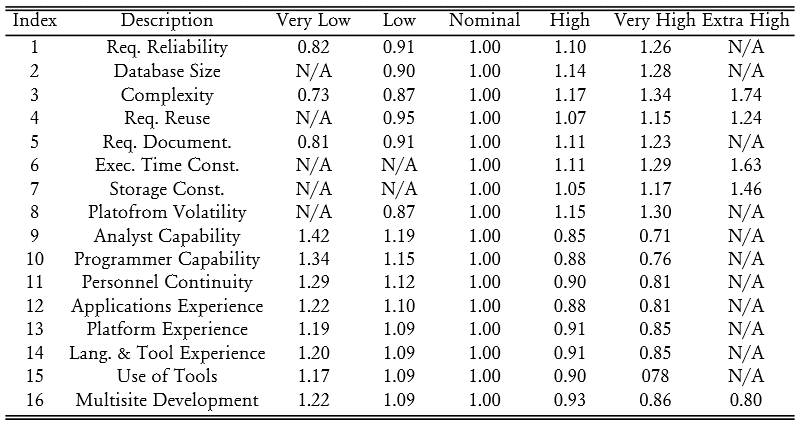
E = 2.94 \cdot L^\beta \cdot \prod_{i=1}^{16} W_i
where W_i is an effort multiplier,
\beta = 0.91 + 0.01 \cdot \sum_{j=1}^{5} \Psi_j,
and \Psi_j is a scale factor
The Scale Factors (\Psi_j):
Effort Multipliers (W_i):
International Software Benchmarking Standards Group (2005)
Additional Notation:
N denotes the (maximum) team size
A General Model:
E = 0.512 \cdot F^{0.392} \cdot N^{0.791}
Other Models:
They have estimated the parameters of this model for
products for mainframes, mid-range systems, desktops
They have estimated the parameters of this model for
different kinds of languages