|
Linear Regression
An Introduction |
|
Prof. David Bernstein
|
| Computer Science Department |
| bernstdh@jmu.edu |

|
Linear Regression
An Introduction |
|
Prof. David Bernstein
|
| Computer Science Department |
| bernstdh@jmu.edu |

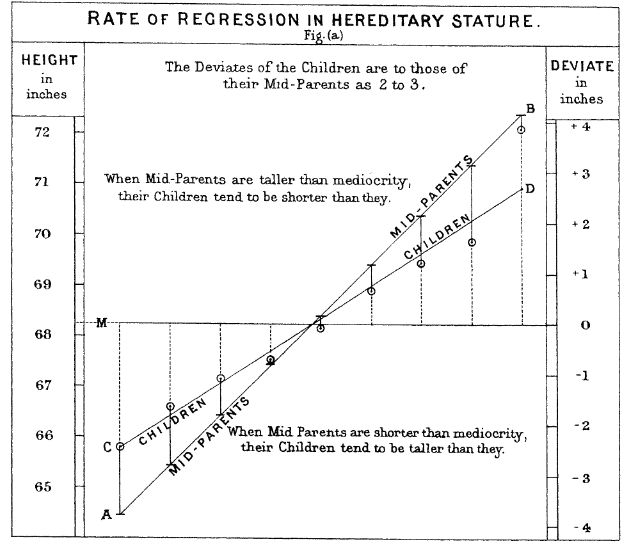
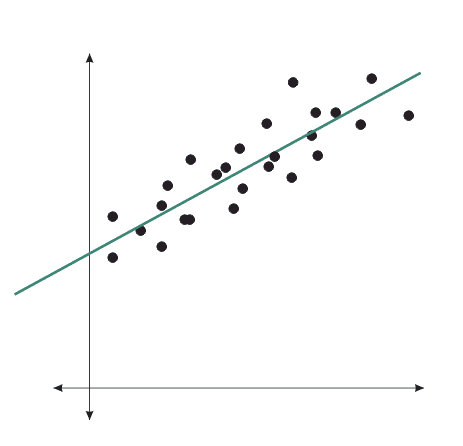
Galton's Data
 vs.
vs.