CS 445: Evaluating Classifier Performance

Confusion Matrix for Two-Class Classifiers

Predicted Class
- +
Actual
Class
- TN FP
+ FN TP
  • One challenge in machine learning is skew (fraction of positive samples):

  • If isn't near .5, we describe it as a skewed data set.
  • Skewed data creates challenges both for training and evaluating classifiers.

Evaluation Metrics

Confusion matrix tells the whole story, BUT we often want a single number to summarize our performance.

  • Accuracy

    • Sensitive to skew, doesn't distinguish between types of error:
      Type I Error = False Positive, Type II Error = False Negative
  • True Positive Rate (TPR)/Recall

  • False Positive Rate (FPR)

    • These distinguish error type, but don't help with skew
  • Precision

    • Meaningful even for highly skewed data, since it only considers positive predictions.
  • F1 Score

    • Both precision and recall must be high for the F1 score to be high.

Classifiers Scores + ROC Curves + AUC

  • Many classifiers are able to produce a score that indicates the model's confidence that is in the positive class.
  • This allows us to adjust our classifier's behavior by changing the classification threshold.
  • Receiver Operating Characteristic (ROC) curve shows the impact of different threshold values:
    ROC curve example
    (Image credit: https://glassboxmedicine.com/2019/02/23/measuring-performance-auc-auroc/)
  • The Area Under the Curve (AUC) provides a single summary value (generally between .5 and 1.0) of the behavior across all possible thresholds

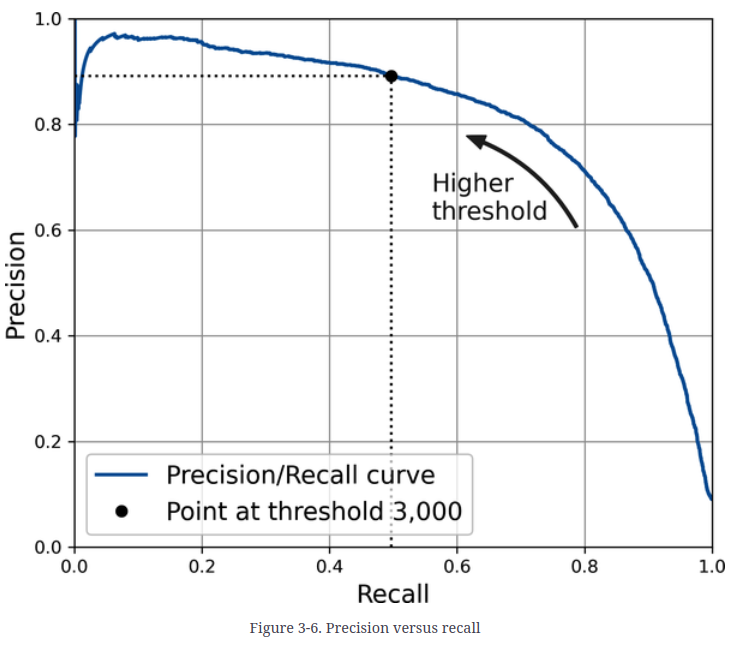
Precision Recall Curve

PR curve example

(Image credit: Hands-On Machine Learning with Scikit-Learn, Keras, and TensorFlow, 3rd Edition, Aurélien Géron, O'Reilly, 2022.)

Quiz: Is the test set used to generate this image skewed?