PA2: Naive Bayes Classifier
Learning Objectives
After completing this activity, students should be able to:
- implement a Naive Bayes classifier for a mixture of discrete and continuous attributes
- define and implement Laplace smoothing to handle zero probabilities
Acknowledgments
This is a lightly-modified version of an assignment originally developed by Kevin Molly.
Partners
This assignment may be completed individually or in pairs. If you are working with a partner, you must notify me at the beginning of the project. My expectation for pairs is that both members are actively involved, and take full responsibility for all aspects of the project. In other words, I expect that you are either sitting (or virtually) together to work, and not that you are splitting up tasks to be completed separately. If both members of the group are not able to fully explain the code to me, then this does not meet this expectation.
Part 1: Implementation
Construct a Naive Bayes classifier.
Resources
| Link to file | Purpose/description |
| nb_classifier.py | Stubs for your classifier |
| nb_classifier_test.py | Unit tests for your classifier |
| MNIST_data.zip | MNist image data for testing your classifier |
Tips for Working with Numpy Matrices with String data
Working with numpy matrices with mixed datatypes is not very convenient. In fact, the Pandas package is very popular with machine learning scientists because it eases some of this pain.
Here is an example of a numpy matrix with categorical and numeric data:
> X = np.array([['Cat', 'Yes', 1.23], ['Dog', 'Yes', 2.45]])
> print(X)
[['Cat' 'Yes' '1.23']
 ['Dog' 'Yes' '2.45']]
> print(X.dtype)
<U4
<U4 means that at most, the column can contain data with 4 characters.
The reference solution includes a function that computes the
probability estimate given \(\mu\), \(\sigma^2\), and a value for the variable
(x). Since the variable may be extracted from a numpy array, it is
possible that it has a character type. On the other hand, the method
feature_class_prob is used to test your code, and it is inconvenient
to pass the data in this way (you just want to pass x as a float).
The following code can address this situation. It queries the
datatype of x (the variable value to estimate the probability) and
if it is a numpy str_, it converts it to a float, otherwise, it just
copies it to xfloat.
Unbiased Estimates of Variance/Standard Deviation
Maintaining the class-conditional pdfs requires us to calculate and store the mean (\(\mu\)) and sample variance (\(\sigma^2\)) values for collections of continuous values. There are actually two different ways to calculate the sample variance of a data set. (See this Wikipedia page for more information.) For this project you should store the unbiased sample variance. The classification results probably wouldn’t be much different either way, but we are following the convention of our textbook. The variance values that you calculate on the defaulted borrower example should be consistent with the values from Figure 4.9 in our textbook. In practice, this just means that you should calculate your variance values like this:
instead of like this:
Variances of zero
When training your classifier on continuous data, it is possible that all the data points have the same value for some feature. This causes a problem when trying to compute the variance.
If you encounter this situation, you must omit this feature from consideration when calculating the probability.
Smoothing with Continuous Values
When working with a Gaussian distribution, theoretically, any value should have a probability greater than zero. For this project, if your class-conditional probability evaluates to zero for a continuous variable, you must assign 10e-9 as the result.
For discrete/categorical features, Laplace smoothing (when requested) addresses this (in other words, do not use this technique for discrete features).
Log Likelihood and Challenges with Smoothing
As discussed in class, using the log likelihood of the probabilities is common in many implementations of Naive Bayes because it prevents numeric underflow.
An issue arises with zero probabilities (a potential issue with discrete non-smoothed examples from the book) since log(0) is undefined. Calculating log(0) in numpy will result in NaN being returned, and you can treat any computation resulting in NaN as having a zero probability.
Testing your Implementation
If you run the nb_classifier_test.py file, it
will build the naive Bayes classifier and validate some of its public
attributes as well as the results from calling the predict function.
These tests are not exhaustive, so consider adding a few tests of your
own.
Part 2: MNIST Dataset
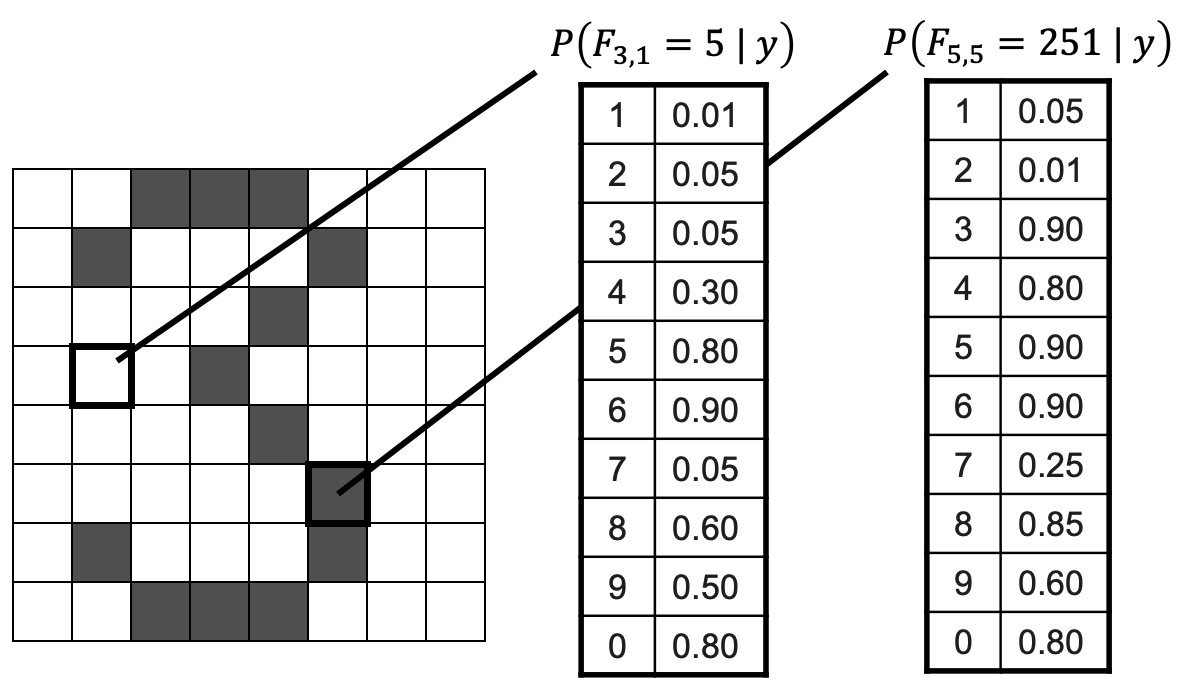
You will apply your Naive Bayes classifier to the MNist database of handwritten digits. The training and test datasets are provided in the resources section. Enclose all of the following analysis and plots in a Jupyter notebook.
Build Model
Build your model and compute the accuracy. You will need to create an
X matrix, and the image data provided is 60k x 28 x 28. Use numpy’s
reshape function to adjust this matrix so that it is 60k x 784.
Use a confusion matrix (10 x 10) to illustrate your results (you can use sklearn to build the confusion matrix). Include 2 to 3 sentences on the quality of your results.
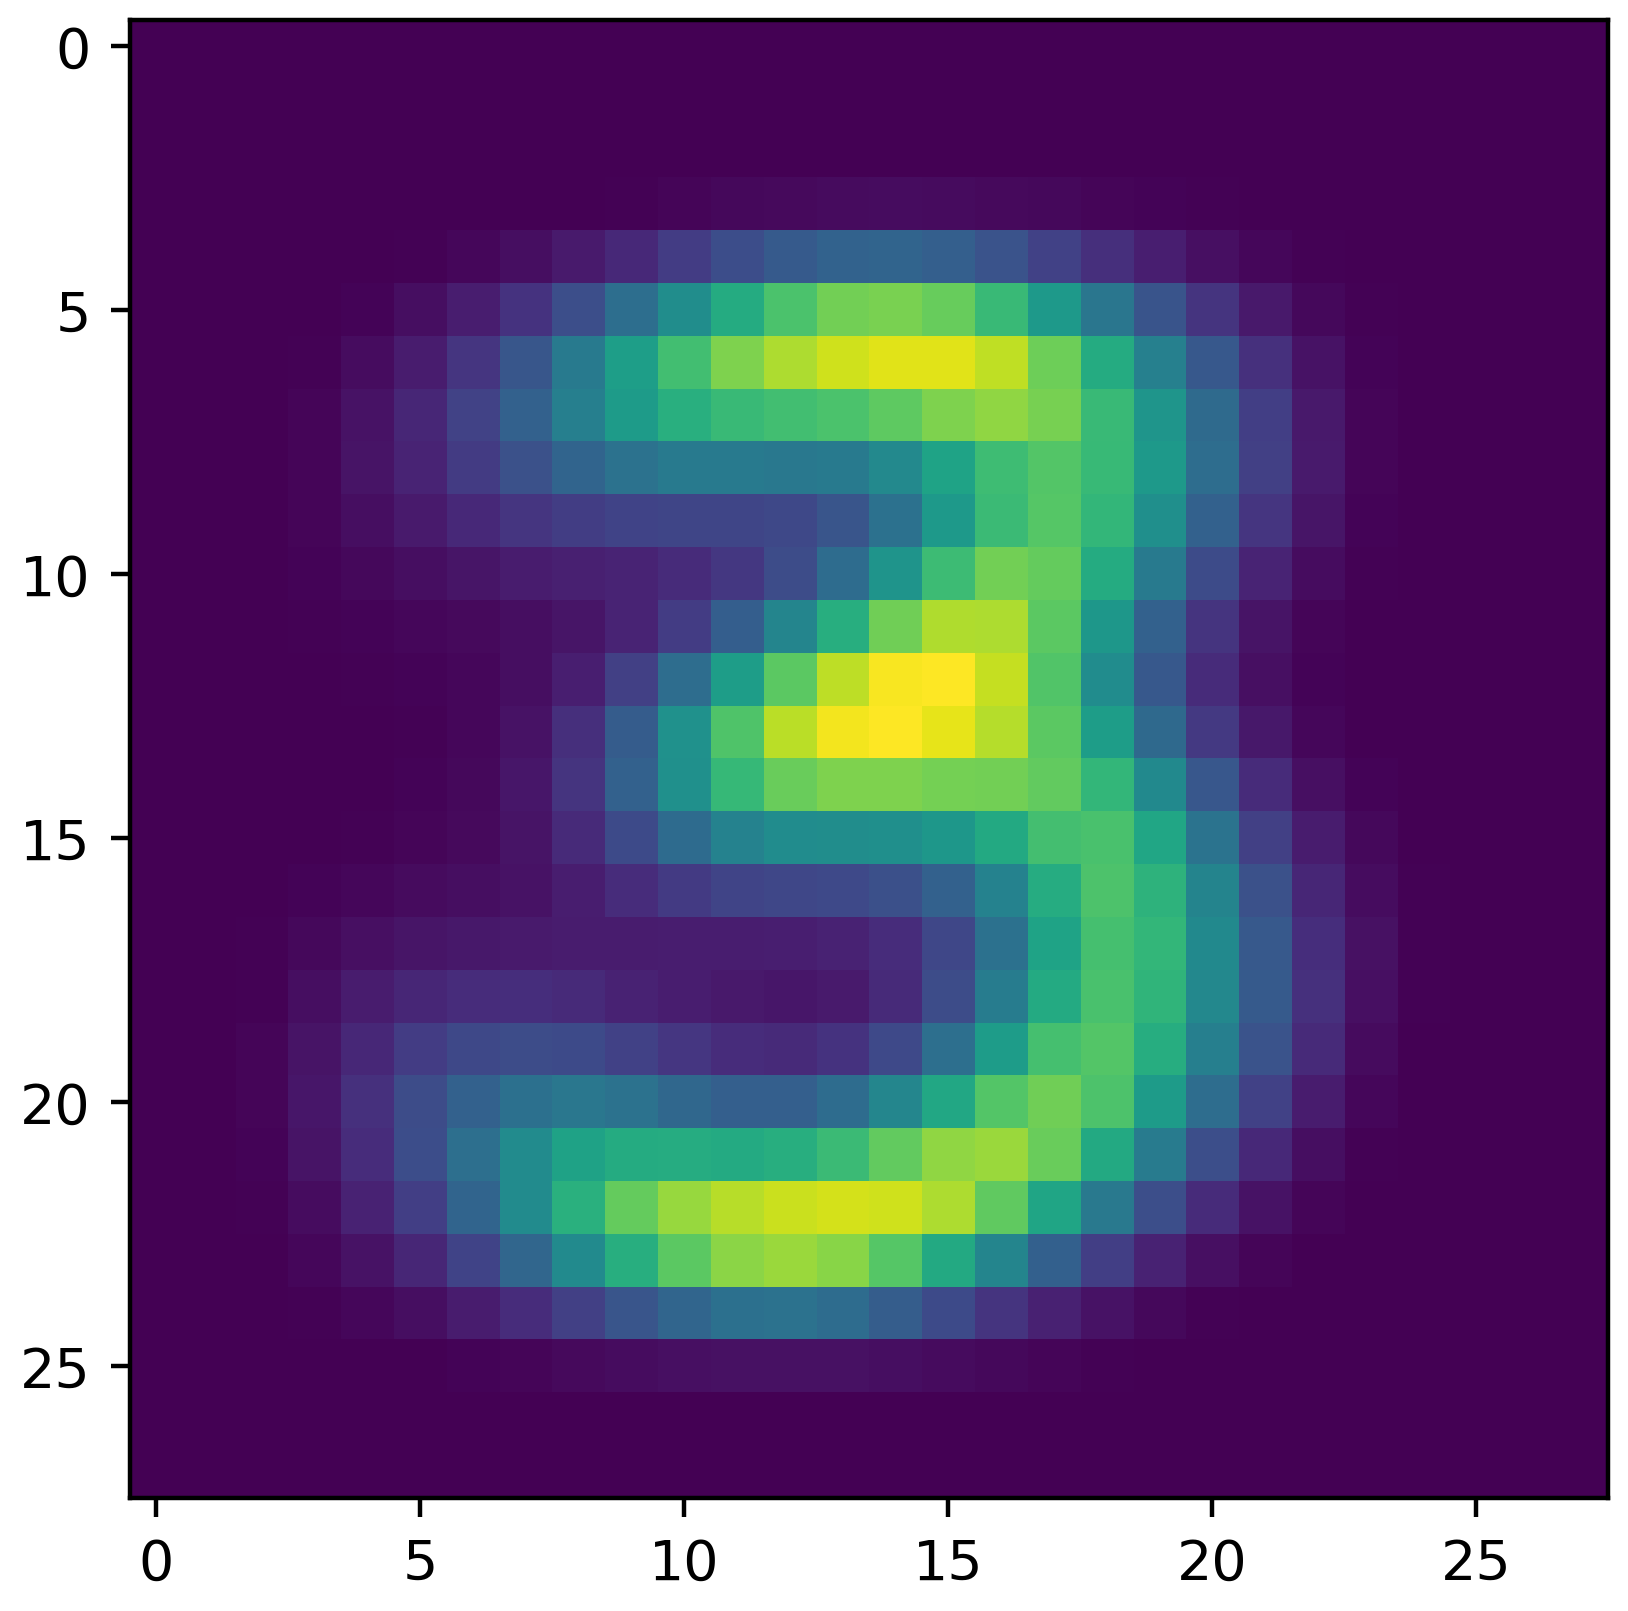
Visualize your Distributions
Being able to visualize your model to verify that it is built correctly is an important step in ML that is often omitted ( sometimes with very bad consequences). In this setting, your model consists of 784 dimensions, so, this could be challenging.
Fortunately, each of the features correspond to a pixel. For each class label/digit, build a heatmap where each pixel in the heatmap is the expected (mu) value for pixel given the label you are plotting. Thus, you should end up with 10 heatmaps.
If you place your mu values in a 784 length numpy array, you can use reshape to make this a 2d array of 28 by 28 (the original dimensions of the image). You can then use plt.imshow to render the heatmap and plt.savefig to save it as a pdf or png file. The image shown is created by my distributions for the label corresponding to the digit 3.
Submission and Grading
This PA has the following required submissions:| Deliverable | Description |
| nb_classifier.py | |
| MNistBayesAnalysis.ipynb notebook | Your notebook can expect that the data files and your nb_classifier.py file are located in the same directory. Your notebook MUST include the plots already rendered (in other words, nothing should need to be run). |
Grading
Grades will be calculated according to the following distribution.| Criterion | Percentage | Description |
| Overall Readability/Style | 10% | Your code should follow PEP8 conventions. It should be well documented and well organized. |
| Part 1: Reference Tests | 70% | nb_classifier_tests.py |
| Part 2: Digit Recognition | 20% | Notebook illustrating your classifier in action on the MNist digit dataset. |