JMU CS 470 Cluster
Hardware
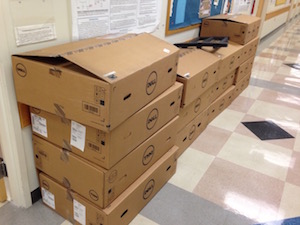
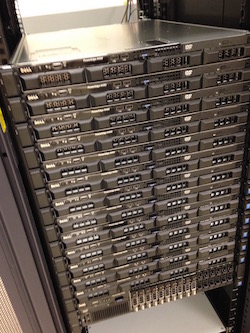
The CS 470 cluster is located in the EnGeo building and is currently comprised of the following hardware:
- 16x Dell PowerEdge R430 w/ Xeon E5-2630v3 (8C, 2.4Ghz, HT) 32 GB – compute nodes
- Dell PowerEdge R430 w/ 2x Xeon E5-2630v3 (8C, 2.4Ghz, HT) 32 GB – login node
- Dell PowerEdge R730 w/ Xeon E5-2640v3 (8C, 2.6Ghz, HT) 32 GB – NFS server
- (in above) 8x 1.2TB 10K SAS HDD w/ RAID - storage
- Dell N3024 Switch 24x1GbE, 2xCombo, 2x10GbE SFP+
|
|
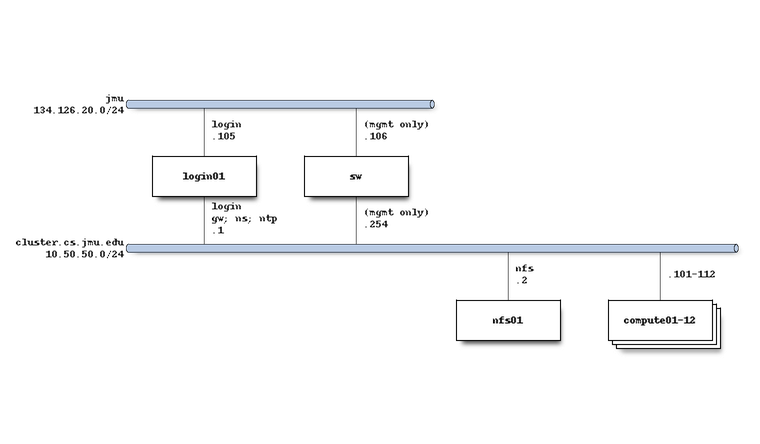
The system network architecture is as follows:
Software
All servers are running RHEL7 with Slurm 15.08 for job management. Environment modules are available for OpenMPI 1.10, MPICH 3.2.1, and the PGI 15.10 compiler. Run module avail to see all available modules, and you can find additional software available in the /shared folder. In particular, you will find several useful utilities in /shared/bin, and I recommend either adding that folder to your PATH environment variable or making symlinks to a folder that is.
Several text editors are installed by default, including nano, vim, and emacs. There are also several other editors located in /shared/bin, including joe, micro, and ne.
If you need software that is not already installed or available via module, it is recommended that you build it from source in your home directory. Check the documentation for the software for instructions on how to do that. If you run into issues or your software is not available in source form, please email the system admin Pete Morris (morrispj) or the faculty contact Mike Lam (lam2mo) to request assistance.
On-campus Access
The login node is accessible via SSH as
login.cluster.cs.jmu.edu from the campus network.
It is recommended that you set up public/private key SSH access from your most frequent point of access machines. To do this, first generate a public/private keypair if you have never done so on that machine:
ssh-keygen -t rsa
If prompted, accept the default location and passphrase options by pressing enter twice. Then, copy the public key to the login node:
ssh-copy-id <eid>@login.cluster.cs.jmu.edu
Now you won't need to enter your password every time you log in from that point of access. Here is a slightly longer tutorial if you'd like to learn a bit more about this process.
It is also recommended that you edit your ~/.ssh/config file to add an SSH alias. Here is an example entry:
Host cluster
    HostName login.cluster.cs.jmu.edu
    User <eid>
Now you can log into the cluster from your point of access simply by typing this command:
ssh cluster
Off-campus Access
If you are off-campus, you will need to proxy your SSH connection through an on-campus point of access (for CS students, this will probably be stu). To transparently proxy ssh sessions through stu, you can use the "-J" option if it is available:
ssh -J <eid>stu.cs.jmu.edu <eid>login.cluster.cs.jmu.edu
Obviously, it is also recommended that you set up your ~/.ssh/config on your home machine so that you don't have to type all that every time. Properly configured, you can log into the cluster from off-campus very easily. For example:
ssh -J stu cluster
If the "-J" option is not present in your version of ssh, you can add the following to your ~/.ssh/config file:
Host *.oc
   ProxyCommand ssh %r@stu.cs.jmu.edu -W $(echo %h | sed 's/\.oc$//'):%p 2> /dev/null
Now you can log into the cluster from off campus using the following command (and similar syntax for scp):
ssh EID@login.cluster.cs.jmu.edu.oc
For more information on proxies and jump hosts, see this Wikibook page.
If you are on Windows, I recommend using PuTTY and WinSCP, both of which can be configured with public/private key access and transparent proxying through stu. Other popular Windows SSH/SCP clients include Bitvise and MobaXterm.
Home Directories
If you are a student in CS 470, you should have an account already on the
cluster, with a 250MB disk quota in your home directory
(/nfs/home/[eid]). To check your disk usage, use the following
command:
quota -s
If you need more space temporarily, use your designated scratch space
(/scratch/[eid]). CAUTION: The scratch storage space may be
wiped between semesters! If you need more permanent space, please contact
your instructor or the cluster admin.
You can connect directly to your cluster home directory or scratch directory from a Linux lab machine:
- Open the file manager and select File -> Connect to server.
- Enter the following settings:
Server:   login01.cluster.cs.jmu.edu
Type:     ssh
Folder:   /scratch/<eid> or /nfs/home/<eid>
Username: <eid>
Password: <eid password>
Transferring Files
If you need to transfer files back and forth between the cluster and another Unix-based machine (e.g., running Linux or macOS), you can use the scp command (here is a tutorial). If you are off campus, use the -o option to use stu as your jump host (e.g., -o 'ProxyJump stu.cs.jmu.edu' (and you should also consider adding stu to your SSH config so that you can shorten the host name).
If you need to transfer to or from a Windows machine, I recommend using WinSCP, which can support transparent proxying for off-campus access.
For a more seamless experience, I recommend mounting the remote filesystem locally using SSH. If you are doing this from off campus, use the following option to sshfs to jump through stu: -o ssh_command="ssh -J <eid>@stu.cs.jmu.edu"
Here is a script that you may find helpful: mount_cluster.sh
Submitting Interactive Jobs
You may use the login node to compile your programs and perform other incidental tasks. YOU SHOULD NOT EXECUTE HEAVY COMPUTATION ON THE LOGIN NODE! To properly run compute jobs, you must submit them using Slurm. You can find various Slurm tutorials on their website.
To run simple jobs interactively, use the srun command:
srun [Slurm options] /path/to/program [program options]
The most important Slurm options are the number of processes/tasks (-n) and the number of allocated nodes (-N). If not specified, the number of nodes will be set to the minimum number necessary to satisfy the process requirement.
The cluster has sixteen nodes, each of which has an eight-core Intel processor. Hyperthreading is enabled on the hardware but disabled in Slurm, so the maximum number of processes per node according to Slurm is eight. This minimizes unpredictable performance artifacts due to hyperthreading.
Here are some examples:
srun -n 4  hostname                         # 4  processes (single node)
srun -n 16 hostname                         # 16 processes (requires two nodes)
srun -N 4  hostname                         # 4  processes (4 nodes)
srun -N 4 -n 16 hostname                    # 16 processes (across 4 nodes)
If you're running an MPI program, you'll need to use the salloc command instead. Make sure you include the mpirun command as well. Examples:
salloc -n 1 mpirun /shared/mpi-pi/mpipi
salloc -n 2 mpirun /shared/mpi-pi/mpipi
salloc -n 4 mpirun /shared/mpi-pi/mpipi
Submitting Batch Jobs
For longer or more complex jobs, you'll want to run them in batch mode so that you can do other things (or even log out) while your job runs. To run in batch mode, you must prepare a job submission script. This also has the added benefit that you won't have to keep typing long commands. Here is a simple job script:
#!/bin/bash
#
#SBATCH --job-name=hostname
#SBATCH --nodes=1
#SBATCH --ntasks=1

hostname
Assuming the above file has been saved as hostname.sh, it can
be submitted using the sbatch command:
sbatch hostname.sh
The job control system will create the job and tell you the new job ID. The
results will be saved to a file titled slurm-[id].out with the
corresponding job ID. To see a list of jobs currently submitted or running, use
the following command:
squeue
The results should look similar to this:
             JOBID PARTITION     NAME     USER ST       TIME  NODES NODELIST(REASON)
              4267     debug sleep_20   lam2mo PD       0:00      1 (None)
              4266     debug sleep_20   lam2mo  R       0:11      1 compute01
To cancel a job, use the scancel command and give it the ID of
the job you wish to cancel:
scancel [id]
Please be considerate--do not run long jobs that require all of the nodes. Check regularly for runaway jobs and cancel them. If you find that someone else has a long-running job that you think may be in error, please email that person directly (USER@dukes.jmu.edu) and CC the instructor.
For more information on the use of Slurm, see their online tutorials or
read the man pages (e.g., "man sbatch" or "man
squeue").
Sample Submit Scripts
OpenMP application (change NAME, NTHREADS, and
EXENAME):
#!/bin/bash
#
#SBATCH --job-name=NAME
#SBATCH --nodes=1
#SBATCH --ntasks=1
#SBATCH --cpus-per-task=NTHREADS

OMP_NUM_THREADS=NTHREADS ./EXENAME
MPI application (change NAME, NNODES,
NTASKS, and EXENAME):
#!/bin/bash
#
#SBATCH --job-name=NAME
#SBATCH --nodes=NNODES
#SBATCH --ntasks=NTASKS

module load mpi/openmpi-x86_64
mpirun EXENAME
If you use zsh instead of bash, you may need to include the following line
before running module load mpi:
source /usr/share/Modules/init/zsh
Debugging
GDB
It is possible to use GDB to debug multithreaded and MPI applications; however, it is more tricky than serial debugging. The GDB manual contains a section on multithreaded debugging, and there is a short FAQ about debugging MPI applications.
Helgrind
Helgrind is a Valgrind-based tool for detecting synchronization errors in Pthreads applications. To run Helgrind, use the following command:
valgrind --tool=helgrind [your-exe]
For more information about using the tool and interpreting its output, see the manual. Note that your program will run considerably slower with Helgrind because of the added analysis cost.
Performance Analysis
GNU Profiler
To run the GNU profiler, you must compile with the "-pg"
command-line switch then run your program as usual. It will create a file called
gmon.out in the working directory that contains the raw profiling
results. To format the output in human-readable tables, use the
gprof utility (note that you must pass it the original executable
file for debug information):
gprof <exe-name>
The default output is self-documented; the first table contains flat
profiling data and the second table contains profiling data augmented by call
graph information. There are also many command-line parameters to control the
output; use man gprof to see full documentation.
To see line-by-line information (execution counts only), you can use the
gcov utility. To do this, you will also need to compile with the
"-fprofile-arcs -ftest-coverage" command-line options and run the
program as usual. This will create *.gcda and *.gcdo
files containing code coverage results. You can then run gcov on
the source code files to produce the final results:
gcov <src-names>
This will produce *.c.gcov files for each original source file
with profiling annotations.
Callgrind/Cachegrind
You can run Valgrind-based tools without any special compilation flags; in
fact, you should NOT include the GNU profiler flags because that will introduce
irrelevant perturbation into your Valgrind-based results. To run Valgrind-based
tools, simply call the valgrind utility and give it the appropriate
tool name:
valgrind --tool=callgrind <exe-name>
valgrind --tool=cachegrind <exe-name>
This will produce callgrind.out.* and
cachegrind.out.* files in the working directory containing the raw
profiling results. To produce human-readable output, use the
callgrind_annotate and cg_annotate utilities:
callgrind_annotate <output-file>
cg_annotate <output-file>
The Cachegrind output can take a little while to decipher if you're unfamiliar with it. Here are the most frequent abbreviations:
| I | instruction |
| D | data |
| L1 | L1 cache |
| LL | last-level cache (L3 on the cluster) |
| r | read |
| w | write |
| m | miss |
For Cachegrind results, you can also obtain line-by-line information by
passing the source file as a second parameter to cg_annotate. Note
that you may need to specify the full path; check the output of the regular
cg_annotate to see what file handle you should use.
For more information about all the reports that these tools can generate, see the Valgrind documentation (specifically, see the sections on Callgrind and Cachegrind).
There is also a graphical viewer for Cachegrind results called KCachegrind. You
should copy the callgrind.out.* file to a local machine to run the
GUI, which should be available in the labs (just run kcachegrind
from the command line). The output will be more comprehensive if you run both
Callgrind and Cachegrind and pass both output files as parameters to
KCachegrind. Use the "Types" tab to view different kinds of events.
HPCToolkit
To run HPCToolkit on the cluster, you'll want to use the following template Slurm script:
#!/bin/bash
#SBATCH --job-name=JOBNAME
#SBATCH --nodes=NNODES
#SBATCH --ntasks=NTASKS

export SPACK_ROOT=/shared/spack
source $SPACK_ROOT/share/spack/setup-env.sh
export PATH=/shared/hpctoolkit/opt/bin:$SPACK_ROOT/bin:$PATH
export LD_LIBRARY_PATH=/shared/hpctoolkit/opt/lib:$LD_LIBRARY_PATH

module load mpi/openmpi-x86_64
spack load papi

mpirun -np NTASKS hpcrun -t ./EXENAME PARAMS
This script sets up an appropriate environment for running HPCToolkit. You
will need to customize the script by replacing the JOBNAME,
NNODES, NTASKS, EXENAME, and
PARAMS placeholders with the appropriate values. Once the script is
ready, you can submit it to Slurm with the sbatch command as usual.
You can also use similar commands from the script directly on the command-line
to run on the login node, although this is discouraged.
When you run this script, it will launch HPCToolkit's profile measurement
tool (hpcrun) in tracing mode ("-t"). This will
produce a folder named "hpctoolkit-EXENAME-measurements-XXXX",
where XXXX is the ID of the corresponding Slurm submission. After
the profiling run completes, you must post-process the measurement data using
the hpcprof utility:
hpcprof <measurement-folder>
This will produce a second folder named
"hpctoolkit-EXENAME-database-XXXX" that contains a performance
profile database suitable for viewing with the hpcviewer or
hpctraceviewer GUIs. You should not try to run these viewers from
the cluster; you should copy the database folder to your local machine and run
the viewer there. You can download the viewers for many platforms at the HPCToolkit website, and
they should be installed on the lab computers (just run hpcviewer
or hpctraceviewer from the command-line).
External Resources
- Slurm: Tutorials | Quickstart | QuickRef | srun | sbatch | squeue | scancel
- Pthreads: LLNL tutorial | Randu.org tutorial | API standard
- OpenMP: LLNL tutorial | QuickRef | API standard
- MPI: LLNL tutorial | QuickRef | API standard
- Chapel: Cray tutorial | QuickRef | Docs | LangRef
- HPCToolkit website