Activity 8: Inheritance
Provided Files
Documentation
How to Use the Debugger
To debug your code, you first need to set a breakpoint (a stopping point in your code). In VS Code, you can do this by clicking in the gutter (the space to the left of the line numbers) next to a line of code. A red dot 🔴 will appear, indicating that the breakpoint has been set.

Then run your program in debug mode by pressing F5 or clicking the dropdown next to the Run icon and selecting "Debug Java".

Your program will run until it reaches the breakpoint, at which point it will pause, and you can inspect variables, step through code, and evaluate expressions, like so:
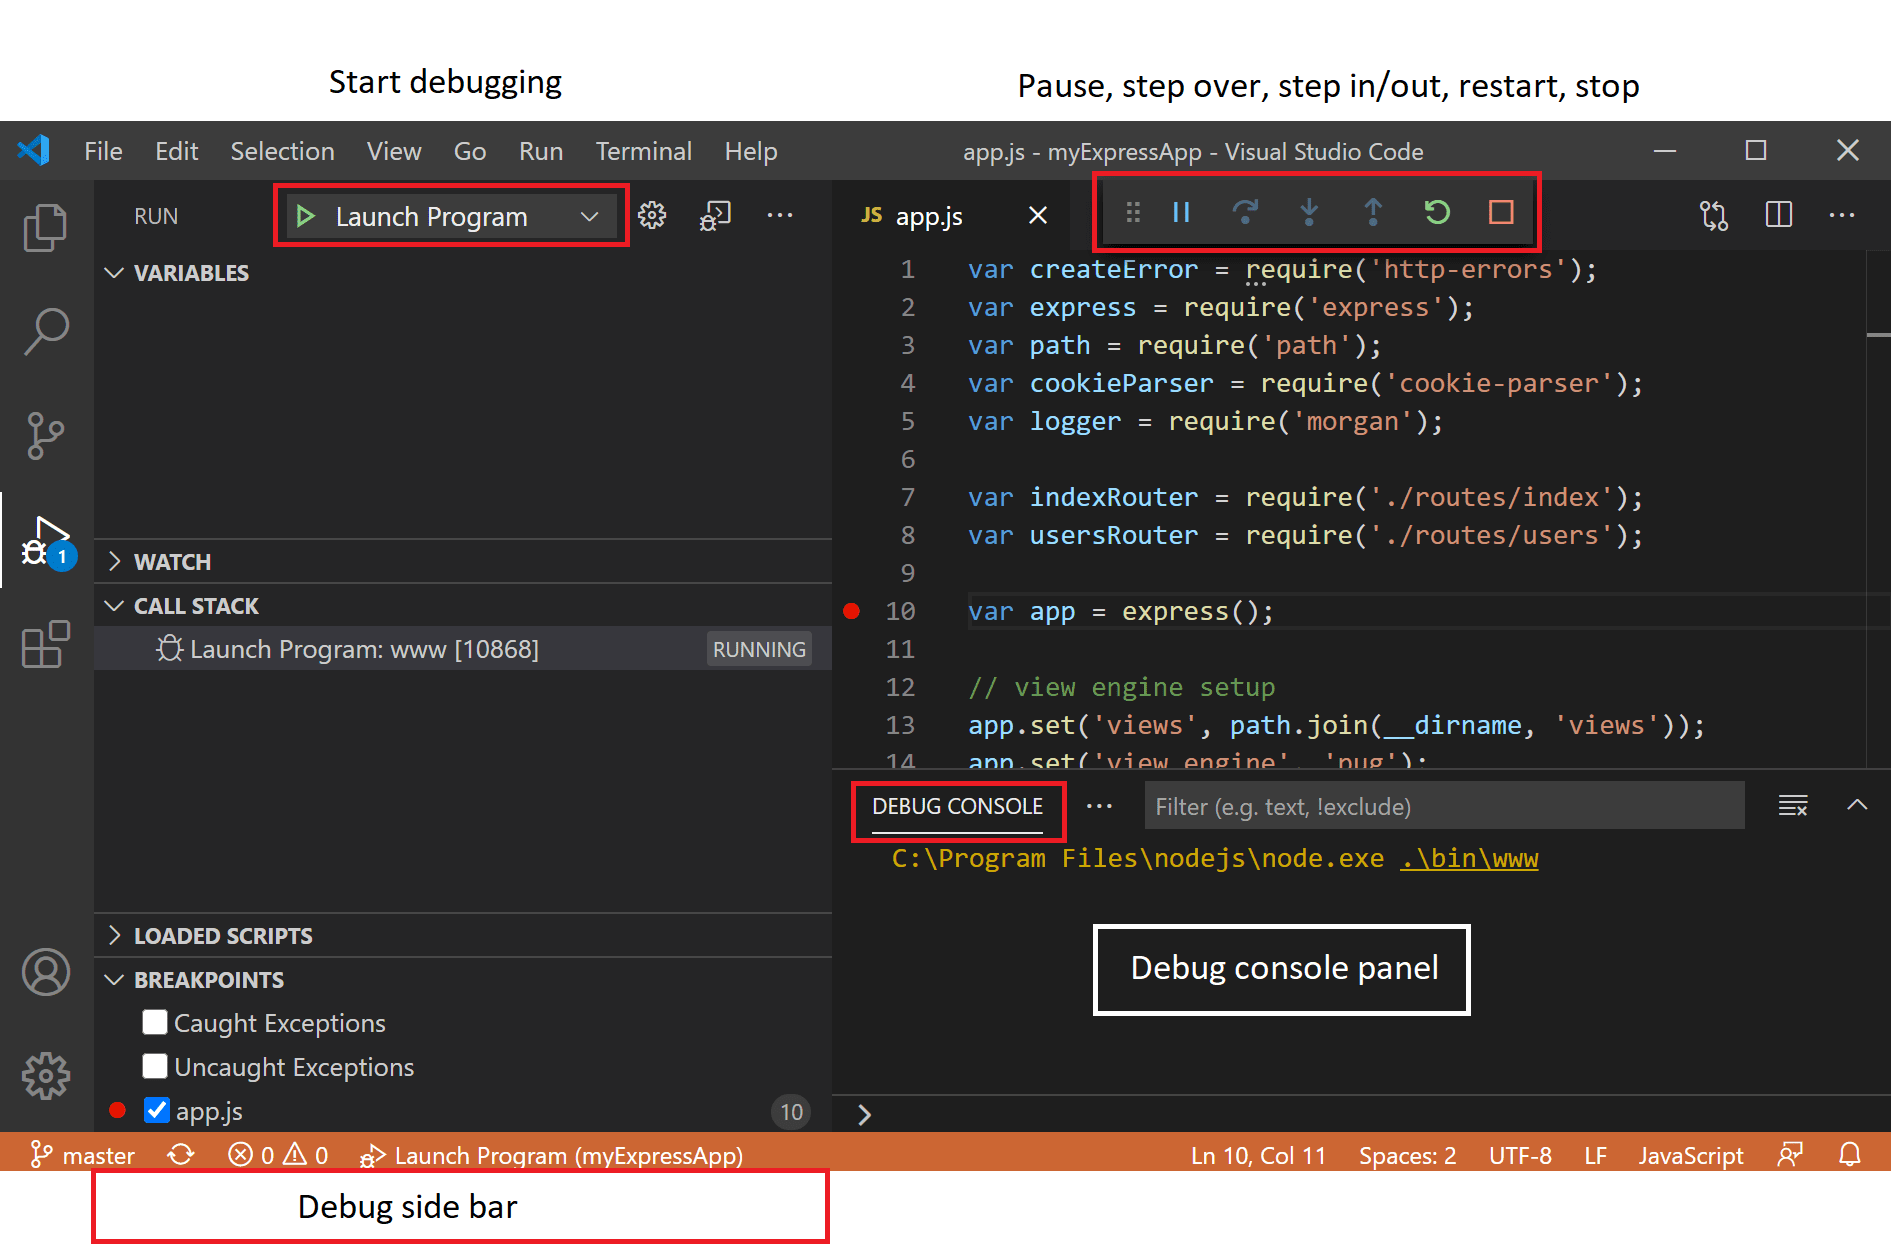
Then you can use the Debug toolbar to step through your code, continue running, or stop debugging. See VS Code: Debug actions.

- We recommend you use the "Step Over" (F10) action to go to the next line of code without stepping into methods.
- If you want to go into a method call, use "Step Into" (F11).
- You can hover over variables in the code to see their current values.
- You can also use the "Variables" pane to see all local variables and their values.
- If you want to let the program continue running until the next breakpoint, use the "Continue" (F5) action.