- Forward


Project Progress Tracking
An Introduction


Prof. David Bernstein
James Madison University

Computer Science Department
bernstdh@jmu.edu

Print

Motivation
Back SMYC Forward
  • The Objective:
    • Track the progress of a project
  • Some Obvious Metrics:
    • Time
    • Money
A Common Mistake
Back SMYC Forward
  • An Obvious Way to Proceed:
    • Compare the actual amount of time used or money expended to the planned amount (e.g., the plan was that the project would require 80 hours and we have used 40 hours so we have completed 50% of the project)
  • Shortcomings of this Approach:
    • The planned amount (whether measured in time or money) may have been overestimated or underestimated
    • The planned drawdown rate may not have been linear over time (so, just because we have spent 50% of the budget may not mean that the project is 50% complete, even if the original estimate was correct)
A Better Approach - Earned Value Analysis
Back SMYC Forward
  • The Concept:
    • Use a quantifiable measure of progress (called the value)
    • Compare the planned value with the earned value over time
  • The Process:
    • Before the project starts, use the project plan to calculate the planned value for each period, \(V_t^*\)
    • While the project is underway, calculate the actual value for each period, \(V_t\)
Earned Value Analysis (cont.)
Back SMYC Forward
  • Dollar-Based Measures of Value:
    • The monetary business value of the features
  • Feature-Based Measures of Value:
    • The normalized number of features (sometimes called story points)
Earned Value Analysis (cont.)
Back SMYC Forward
Metrics
  • Schedule-Related Metrics:
    • Schedule Variance (in Value Units): \(\sum_{t=1}^{T} V_t - \sum_{t=1}^{T} V_t^*\)
    • Schedule Variance (in Time Units): The difference between the time a particular value was completed and the time that value was planned to be completed (positive when ahead, negative when behind)
  • Cost-Related Metrics:
    • Cost Variance: \(\sum_{t=1}^{T} V_t - \sum_{t=1}^{T} C_t\) where \(V_t\) is measured in dollars and \(C_t\) denotes the costs incurred during period \(t\)
    • Cost Performance Index: \(\frac{\sum_{t=1}^{T} V_t}{\sum_{t=1}^{T} C_t}\)
Earned Value Analysis (cont.)
Back SMYC Forward
Schedule-Related Metrics (cont.)

earned-value-analysis

Types of Burn Charts for Earned Value Analysis
Back SMYC Forward
  • Burn-Up Charts:
    • Show how much value has been completed
  • Burn-Down Charts:
    • Show how much value remains to be completed
An Example Burn-Up Chart Using Story Points
Back SMYC Forward
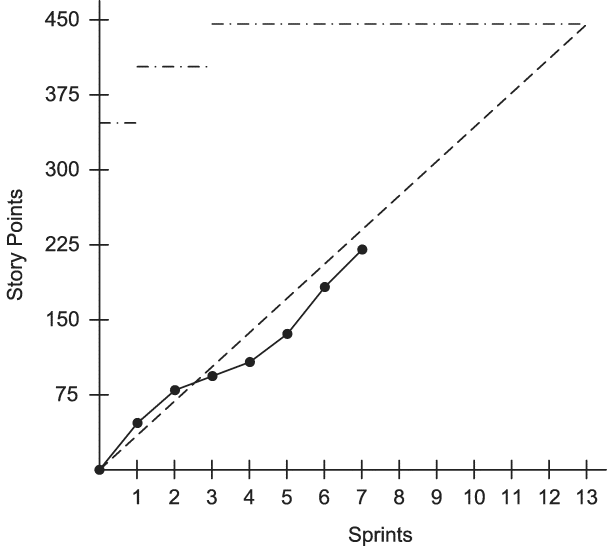
  • The State of the Project after the Seventh Sprint:
    • burn-up-chart_scrum
  • Interpretation:
    • 13 sprints are planned.
    • The number of story points was increased from 350 to 425 to 450.
    • Since story points are a normalized measure of value, the team is expected to complete stories at a constant rate (illustrated by the dashed line)
    • The project started well but has fallen behind.
An Example Burn-Down Chart Using Story Points
Back SMYC Forward
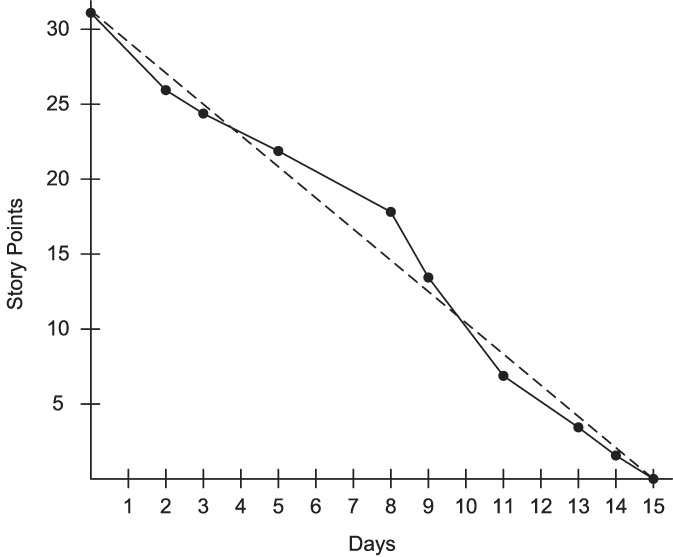
  • The State of the Project during a 15-day Sprint:
    • burn-down-chart_scrum
  • Interpretation:
    • The sprint backlog started with 31 story points worth of PBIs.
    • At the end of day 2, PBIs with a total size of 5 story points had been completed.
    • At the end of day 3, PBIs with a total size of 2 story points had been completed.
    • No more story points were completed until day 5, at which time 2 were completed.
    • ...
There's Always More to Learn
Back -